Learning trees and forests growth dynamics from wood samples [December 2019 - January 2020]

01/12/2019 - 31/01/2020, Tervuren, Belgium
When conducting research on the carbon cycle and its sequestration by a forest ecosystem, understanding the growth dynamics of the above ground biomass is essential. There are various approaches to study these dynamics, one which being the anatomical observation of the wood formed year after year by the trees as they grow.
The sampling of increment cores constitutes a non-destructive approach to study the wood anatomy along a radial transect, from the pith located at the center of the trunk to the bark. The distribution and variability of anatomical features along such a transect can serve as a proxy of a tree’s growth dynamics. Understanding the growth of individual trees is a key opening more knowledge on the overall growth dynamics of entire species and even whole forest ecosystems. It is therefore valuable to develop methods of accessing and analyzing these data, such as the distribution of vessel sizes along a pith-to-bark transect or the distribution of the growth rings. Here is an overview of an analytical method currently used at the Royal Museum for Central Africa to research the possible link between the anatomical pattern visible on increment cores and the growth periodicity of the of multiple species from the Entandrophragma genus.
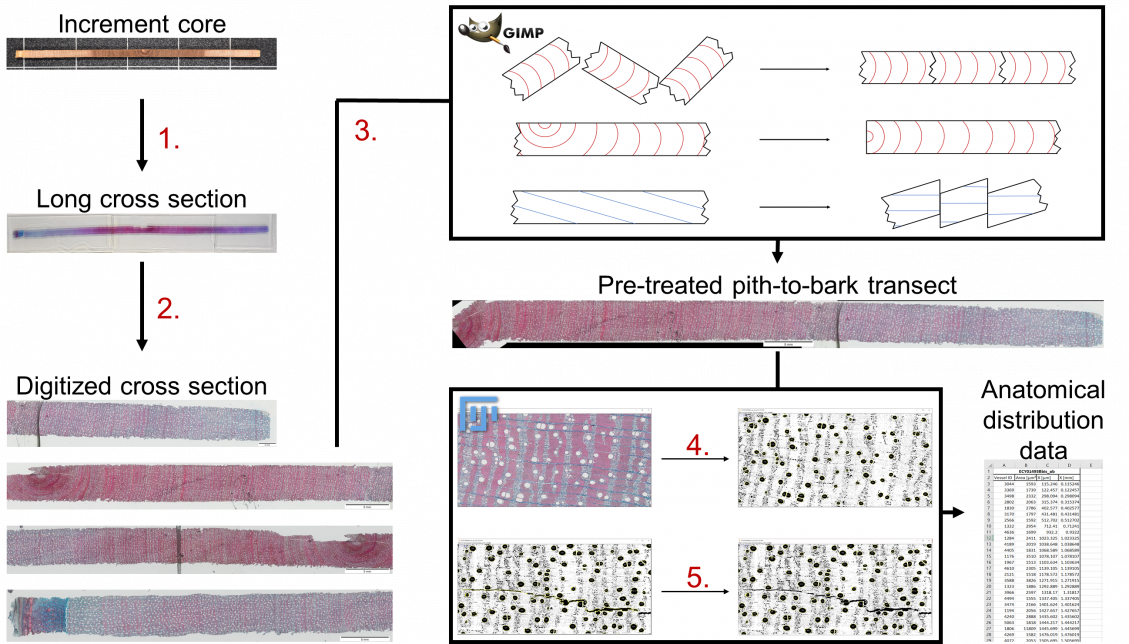
- Extraction of 10 to 20 µm thin cross sections using a core-microtome (WSL, Switzerland). Staining of the cross section;
- Digitization of the cross sections with Stream Motion (Olympus Optical Co. Japan) on a scanning stage (Märshäuser Wetzlar, Germany);
- Pre-treatment of the images with an image manipulation program such as GIMP2 (www.gimp.org). The center of the pith is placed at the origin of the X axis. Corrections are applied to assure that parenchyma rays are parallel with the X axis along the entire profile. This step includes associating fragments to reconstruct a linear and continuous cross section;
- Automated treatment of the images with ImageJ (www.imagej.net). Data such as the position, size, and vessels density along the pith-to-bark transects are acquired;
- Manual post-treatment. The anatomical features of interest (i.e. the vessels) that were not recognized by the algorithm are added. Unwanted elements are removed;
Félix Laurent, 05/05/2020